BOS: break of structure
A candle closes beyond the last confirmed swing in the direction the structure is already going: above the last swing high in an up structure, or below the last swing low in a down structure.
Trading guide
Ask five traders whether a move was a "CHoCH" and you will often get five answers. Most of the disagreement comes from rules that are never written down: how big a swing must be, and whether a wick counts. This guide writes the rules down, so two people reading the same chart get the same answer.
By Rana Usman · 19 November 2026 · 6 min read · Educational, not financial advice.
Step 1
Structure is built from swing highs and swing lows, so everything depends on how you define them.
The number 5 is a choice, not a law. What matters is that you keep the same number for the whole chart.
Step 2
A wick that pokes through the last swing and closes back inside is not a break. Counting only closes removes most of the arguments about whether a break happened, and it means the answer cannot change while the candle is still forming.
A candle closes beyond the last confirmed swing in the direction the structure is already going: above the last swing high in an up structure, or below the last swing low in a down structure.
The first candle that closes beyond the last confirmed swing against the structure: for example the first close below the last swing low after an up structure. After a CHoCH, the structure is read the other way.
When a chart opens there is no structure yet. The first break you see is simply called a BOS, and it sets the direction that later breaks are compared with.
On a real chart
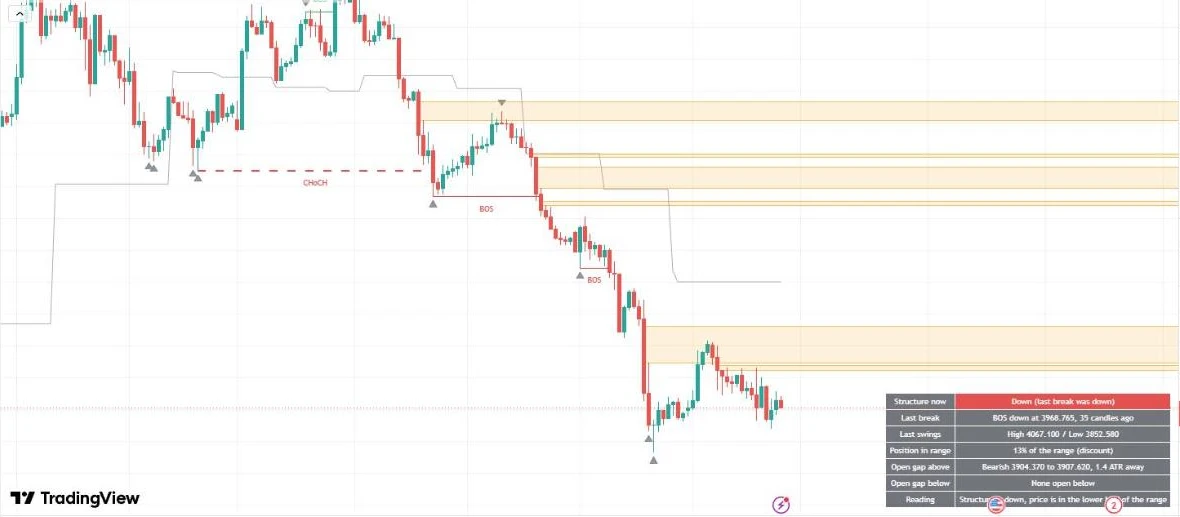
Read it from left to right: each time a candle closed beyond the last swing, a line was drawn at that swing. Breaks in the same direction as the one before are BOS; the first break the other way is the CHoCH.
Check it yourself
Go left to right and mark every candle whose high or low beats the 5 candles on each side. Only mark it once those 5 candles have closed.
Find the first candle that closes beyond the last marked swing high or low. Call it a BOS and note the direction.
Each later close beyond the last swing in the same direction is another BOS.
The first close beyond the last swing in the other direction is a CHoCH. From then on, compare breaks with the new direction.
Common mistakes
Limits
Questions
Both are a candle closing beyond the last confirmed swing. A BOS (break of structure) happens in the direction the structure is already going, for example a close above the last swing high in an up structure. A CHoCH (change of character) is the first close beyond the last swing against the structure, for example the first close below the last swing low after an up structure.
Not with the rules on this page. Only a candle close beyond the swing counts. A wick that goes through the level and closes back inside is not a break. Using closes removes most of the disagreement people have about whether a break happened.
No. A CHoCH only describes what price has already done: it closed beyond a swing against the structure. Price can turn, or it can go straight back the other way and print another break. It is a description, not a prediction.
There is no correct number, but you should pick one and keep it. This page uses 5 candles on each side. A smaller number gives more, smaller swings and more breaks; a bigger number gives fewer, larger ones. Changing the number in the middle of a chart changes every label on it.
Any, as long as you say which one. Structure on the 15-minute chart and on the 4-hour chart can point in opposite directions at the same moment, and both can be correct for their own timeframe.
Market Structure Map applies exactly these rules on TradingView and cTrader and explains the result in a small panel. It gives no buy or sell signals.