Swings, confirmed and fixed
A swing high or low is marked once the chart has printed 5 more candles on its right (you can change the number). The mark appears that many candles late, and after that it never moves.
Charting tools for forex and gold traders
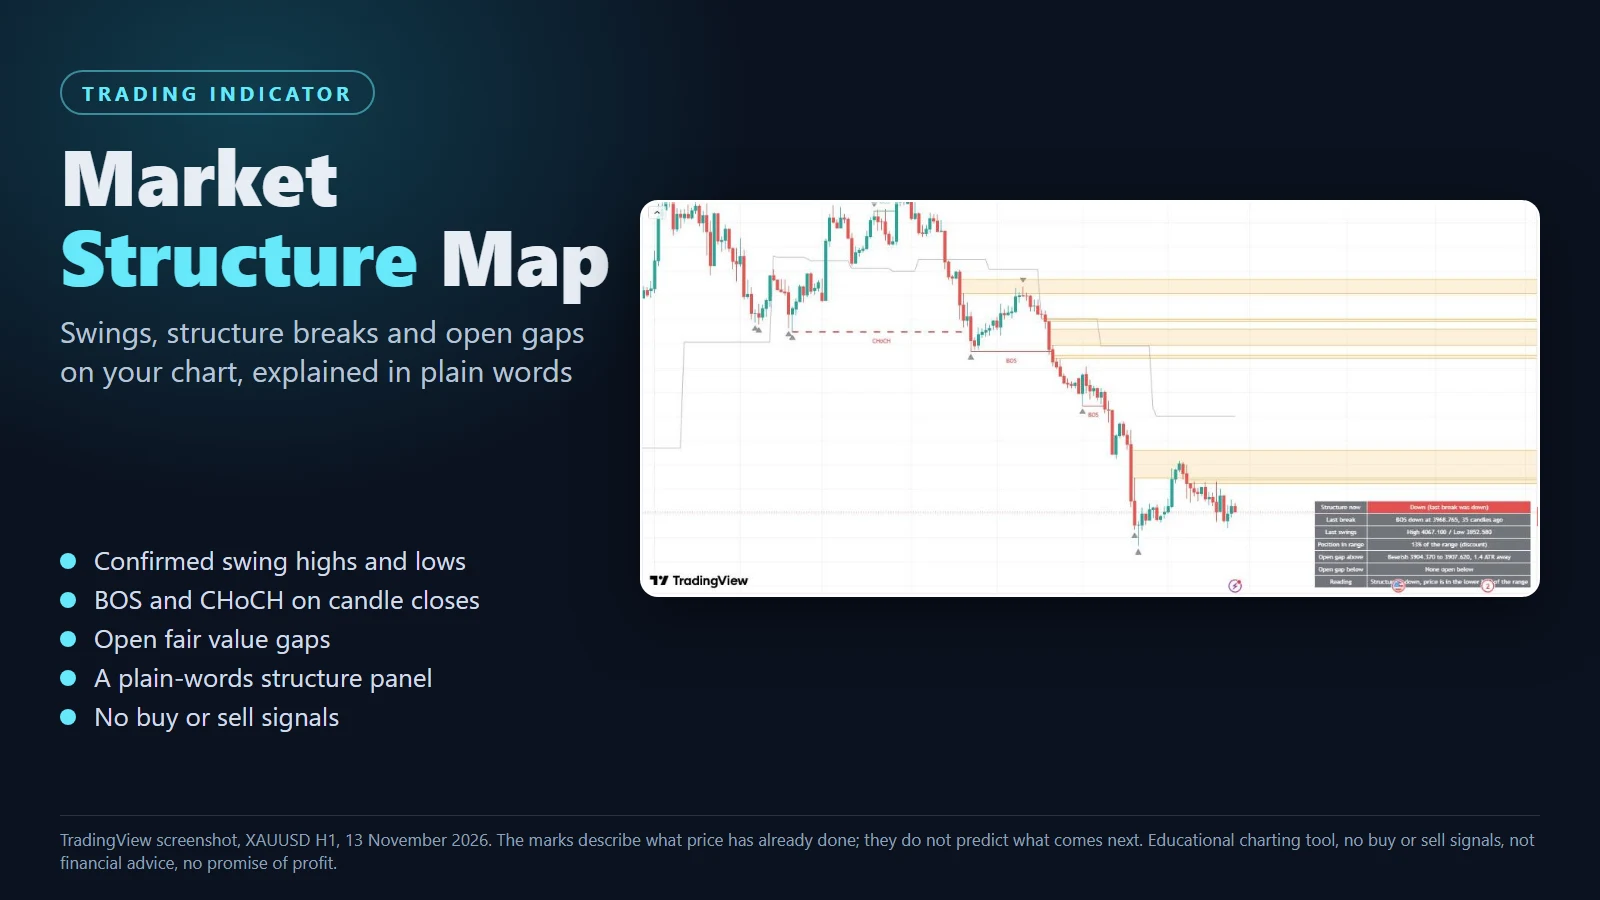
Market Structure Map is a charting indicator that marks the structure of the chart with fixed rules: confirmed swing highs and lows, structure breaks (BOS and CHoCH) decided on candle closes, and open fair value gaps. A small panel says in plain words what the structure is now, where the last break happened and where price sits inside the current swing range. It gives no buy or sell signals: it shows the picture, and you make the decision. You get the TradingView version (Pine Script) and the cTrader version (indicator file and C# source).
US$17 per month, or US$179 per year · Educational charting tool, not financial advice.
What it does
Many traders mark swing highs and lows, structure breaks and fair value gaps by hand on every chart, and two people rarely mark them the same way. Market Structure Map draws them with fixed rules and explains the result in a panel, so you can see what the chart has done and why a mark is there. It does not predict anything and it never says what to trade.
A swing high or low is marked once the chart has printed 5 more candles on its right (you can change the number). The mark appears that many candles late, and after that it never moves.
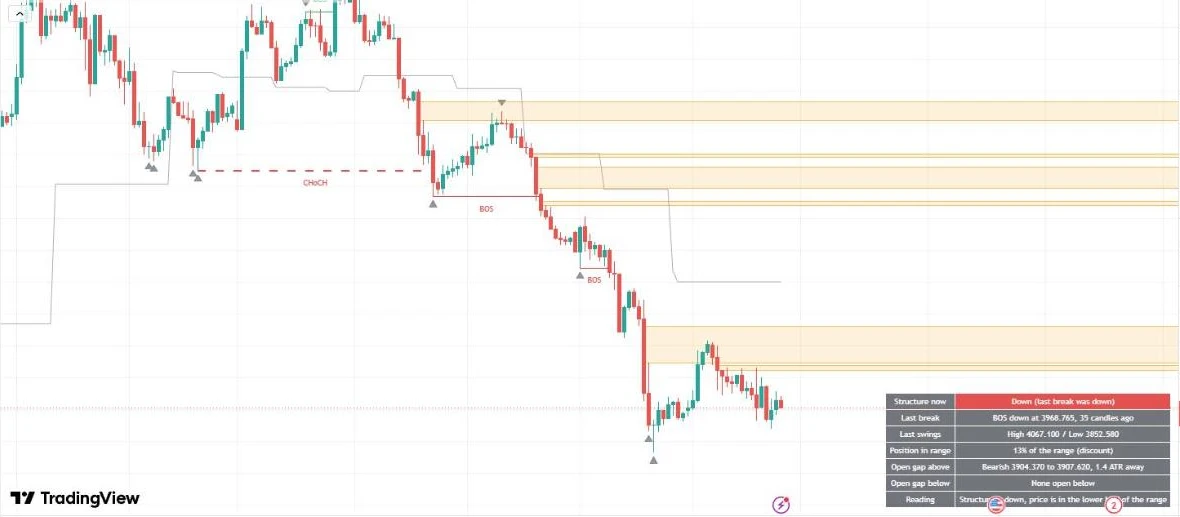
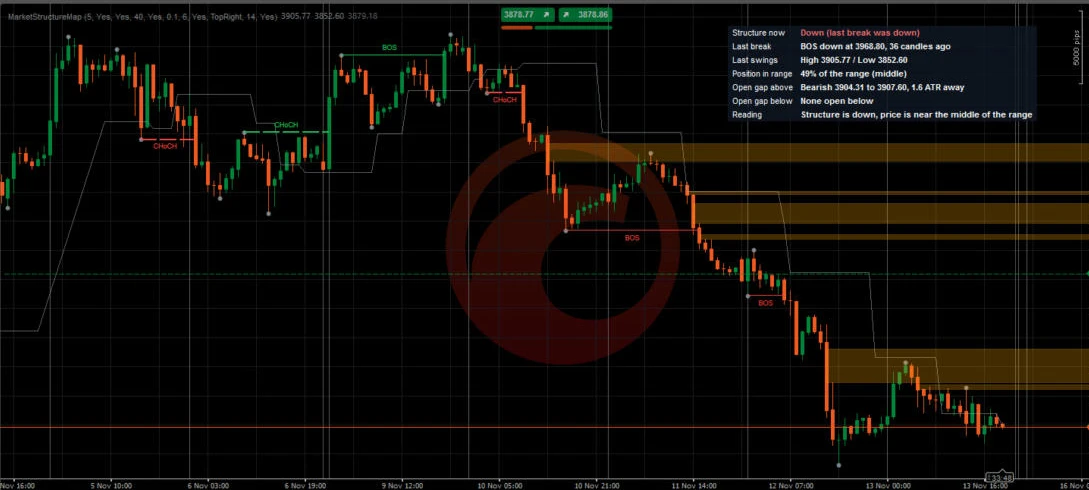
A line is drawn when a candle closes beyond the last swing: BOS in the direction of the current structure, CHoCH (dashed) when it is the first close against it. A wick through the level is not a break.
A gap left by a three-candle move is drawn as a box and stays until price trades through its far edge, then it disappears. Tiny gaps are ignored and only the latest few are kept, so the chart stays readable.
Seven short rows: structure now, last break, last swings, position in the swing range (premium, middle or discount), the nearest open gap above and below with its distance in ATR, and a one-line reading.
Choose the swing length, whether to show swings, breaks and gaps, how big a gap must be, how many open gaps to keep, the ATR length and where the panel sits.
Alerts for a new BOS, a new CHoCH and for price closing inside an open gap. They tell you what happened. They never tell you to buy or sell.
The words
A candle whose high (or low) is beyond those of the candles on each side of it. It is only known after those candles have printed.
A candle closes beyond the last swing in the direction the structure was already going, for example a close above the last swing high in an up structure.
The first candle that closes beyond the last swing against the structure, for example the first close below the last swing low after an up structure.
A gap between the first and the third candle of a three-candle move, which the middle candle left open. It is called open until price trades back through it.
The swing range is the last confirmed swing high to the last confirmed swing low. Above its middle is called premium, below it discount. It describes where price sits, not what it will do.
How it works
Paste the Pine script into TradingView, or install the indicator file in cTrader. A free TradingView account is enough, because it takes one indicator slot.
It uses the candles of the chart you have open, so it works on any symbol. Pick a timeframe such as H1 and, if you like, change the swing length.
Check the panel and the marks before you decide anything. The indicator never places trades and never says what to trade.
On the chart
What you get
Honest limits
Plans
Both plans include the TradingView and cTrader versions and updates while the plan is active. Nothing renews or charges by itself.
Monthly
US$17 per month · about AED 62
Yearly
US$179 per year · about AED 657
The licence allows personal use on your own accounts. No resale and no sharing. Refunds: if the files will not load and we cannot fix it, you can ask within 7 days of purchase.
Choose a plan and send a WhatsApp message with the button on this page.
Pay by PayPal or bank transfer. Nothing is charged automatically.
After payment is confirmed you receive the download link and the install guide.
For the monthly plan, send the next payment before the month ends to keep updates. Nothing renews by itself.
Requirements
| Platform | TradingView (Pine Script v6; a free account works within its limit on indicators per chart) or cTrader (indicator file, run in cTrader 5.10.22). |
|---|---|
| Chart | Any symbol and timeframe. It was checked on gold and EURUSD, on the 1-hour and 15-minute charts in TradingView and on the 1-hour chart in cTrader. |
| Data | Only the candles of the chart you have open. It does not read other symbols. |
| Delivery | After your payment is confirmed you receive a download link for the bundle by WhatsApp or email. |
Questions
No. It does not say when to buy or sell. It marks swings, structure breaks and open gaps with fixed rules and explains them in a panel. You make every decision yourself.
On candle closes only. When a candle closes beyond the last confirmed swing high or low, a line is drawn from the swing to that candle. If it goes the same way as the current structure it is a BOS; if it is the first one against it, it is a CHoCH. A wick through the level does not count.
Marks are decided on closed candles. A swing mark appears after the chosen number of candles (5 by default) and then stays where it is; breaks and gaps are added when a candle closes. The newest candle is still forming, so the panel changes until it closes. Closed candles do not change afterwards.
A gap is drawn as a box and stays open until a later candle trades through its far edge. Then the box is removed. Gaps smaller than a set fraction of the ATR are never drawn, and only the latest few open gaps are kept.
It was checked on gold (XAUUSD) on the 1-hour chart and EURUSD on the 15-minute chart in TradingView, and on gold and EURUSD on the 1-hour chart in cTrader. It uses the candles of the open chart, so it also runs on other symbols and timeframes, but those were not tested.
Yes, gold on the 1-hour chart is one of the charts it was checked on. The marks describe what price has already done; they are not a prediction for gold.
No. You paste the script into your own TradingView account. A free account is enough, within its limit on indicators per chart.
Yes: the same swings, breaks, gaps and the same panel rows. The prices come from each platform's own data, so marks can differ slightly between brokers and between the two platforms. On the same chart the last break and the nearest open gap matched within the small differences between the two data feeds.
Message us. If the files will not load on TradingView or cTrader and we cannot fix it, you can ask for a refund within 7 days of purchase.
Market Structure Map is an educational charting tool. It is not financial advice, not a signals service and it makes no promise of profit. Trading is risky and you can lose money.
Pick a plan and message us on WhatsApp. US$17 per month or US$179 per year.