Trading indicators

Indicators that make the chart easier to read.

Charting tools for TradingView and cTrader. Each one turns a clear rule into marks and levels you can see and understand. They are educational tools: not signals, not financial advice, and no promise of profit.

TradingView and cTrader · XAUUSD, H4 chart

Gold Trend Breakout

Daily-trend breakout levels for gold (XAUUSD) on the H4 chart, with stop and target levels drawn for you.

  • Reads the daily trend and marks a breakout when an H4 candle closes beyond the previous 100 candles
  • Draws the stop (2 x ATR) and the target (1:2), and marks where each was reached
  • Decided on closed candles, with a status panel, alerts and an optional position-size label

US$17 per month · or US$179 per year
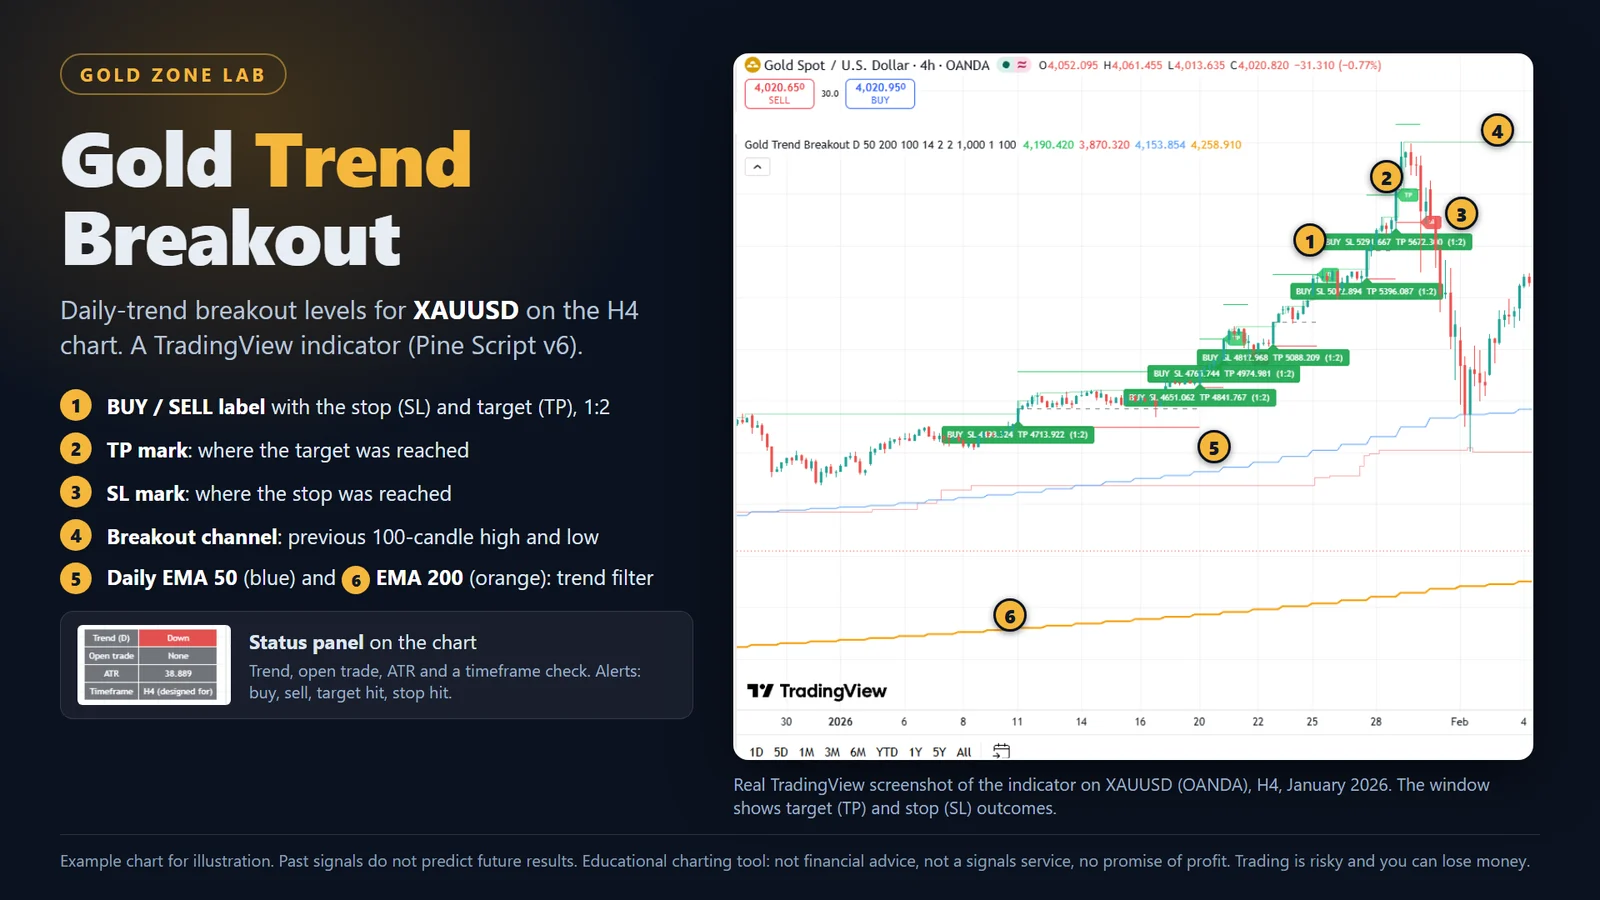
Gold Trend Breakout on an XAUUSD H4 chart with labelled buy marks, stop and target levels

Built to explain the chart

Each indicator turns one clear rule into marks and levels you can see, so you understand why something is drawn.

No promise of profit

These are educational charting tools. They are not signals, not financial advice, and they do not place trades.

Real screenshots, losses included

Pictures come from the indicator running on a real chart, with stop and target outcomes in view.

More indicators are added here as they are finished and tested. Trading is risky and you can lose money. Questions? Contact us.