Is it a signals indicator?
No. It does not say when to buy or sell. It shows the trend of one symbol on five timeframes in a small table, in plain words. You make every decision yourself.
What exactly does a row show?
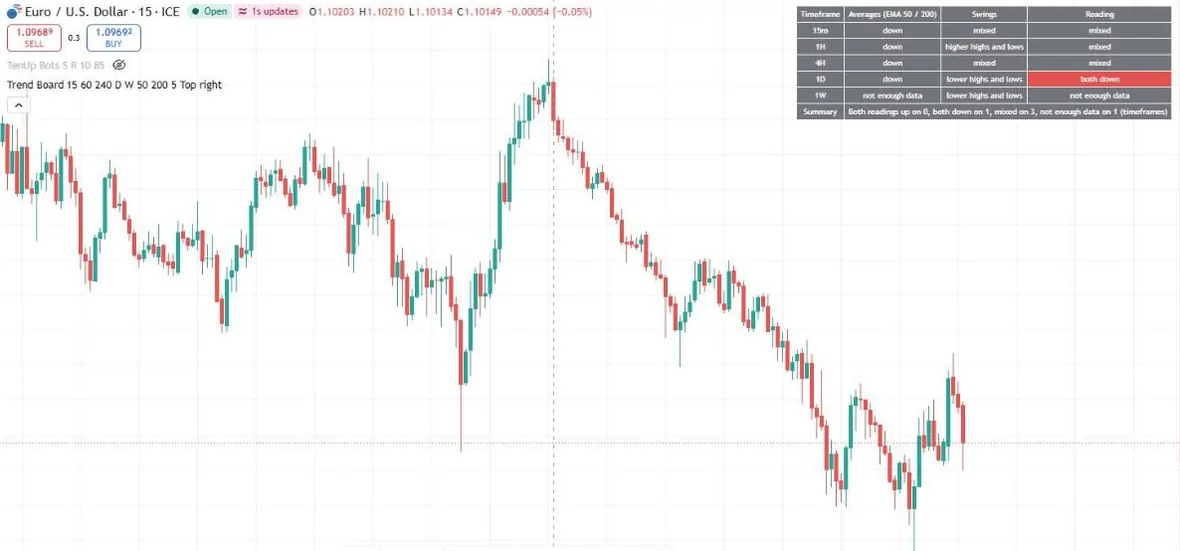
Two readings for that timeframe: the averages (the fast EMA against the slow EMA, and the close against the fast one: up, down or mixed) and the swings (the last two confirmed swing highs and lows: higher highs and lows, lower highs and lows, or mixed). The last column says "both up" or "both down" only when the two agree, and "mixed" otherwise.
Does it repaint?
Each timeframe is read on its last closed candle, so a row changes only when a candle of that timeframe closes. A swing is only known after 5 more candles have printed (a setting), so a new swing changes a row only after that delay.
Do the TradingView and cTrader versions show the same board?
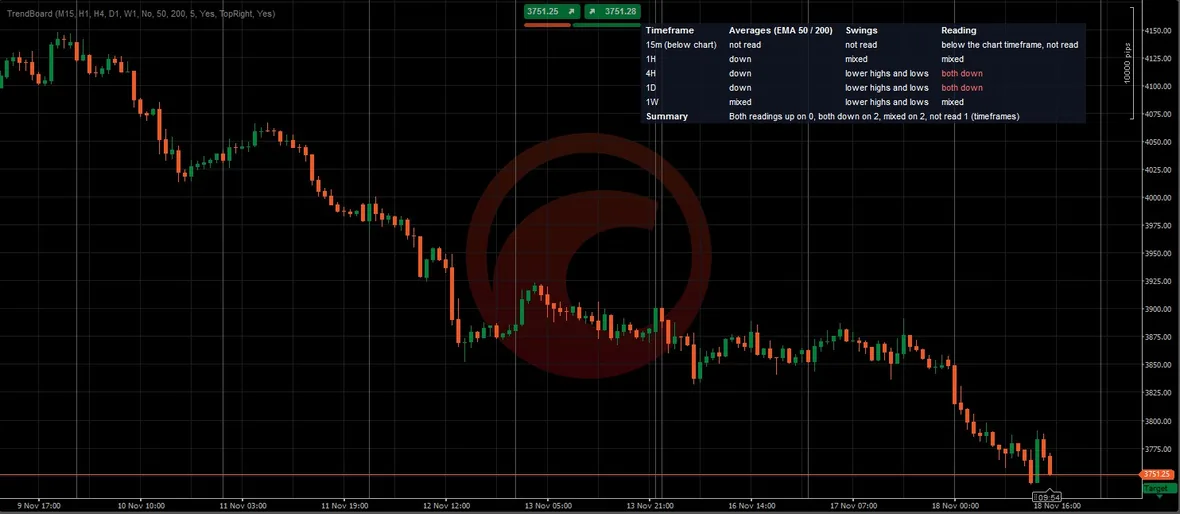
They follow the same rules, but in testing they did not give the same board on the same chart. On XAUUSD H1 on 18 November 2026, TradingView read the swings of the 4-hour and 1-day rows as mixed and the 1-week row as higher highs and lows, while cTrader read all three as lower highs and lows. Each platform holds a different amount of history for a slow timeframe, and the last two swings depend on it. The exact cause has not been worked out, so treat each platform's board as its own reading.
Which markets and timeframes does it work on?
It was checked on EURUSD on the 15-minute chart and gold (XAUUSD) on the 1-hour chart in TradingView, and on gold on the 1-hour chart in cTrader. It reads the symbol of the open chart, so it also runs on other symbols, but those were not tested. In the cTrader version a timeframe below the chart's own timeframe is not read, and its row says so.
Why does a row say "not enough data"?
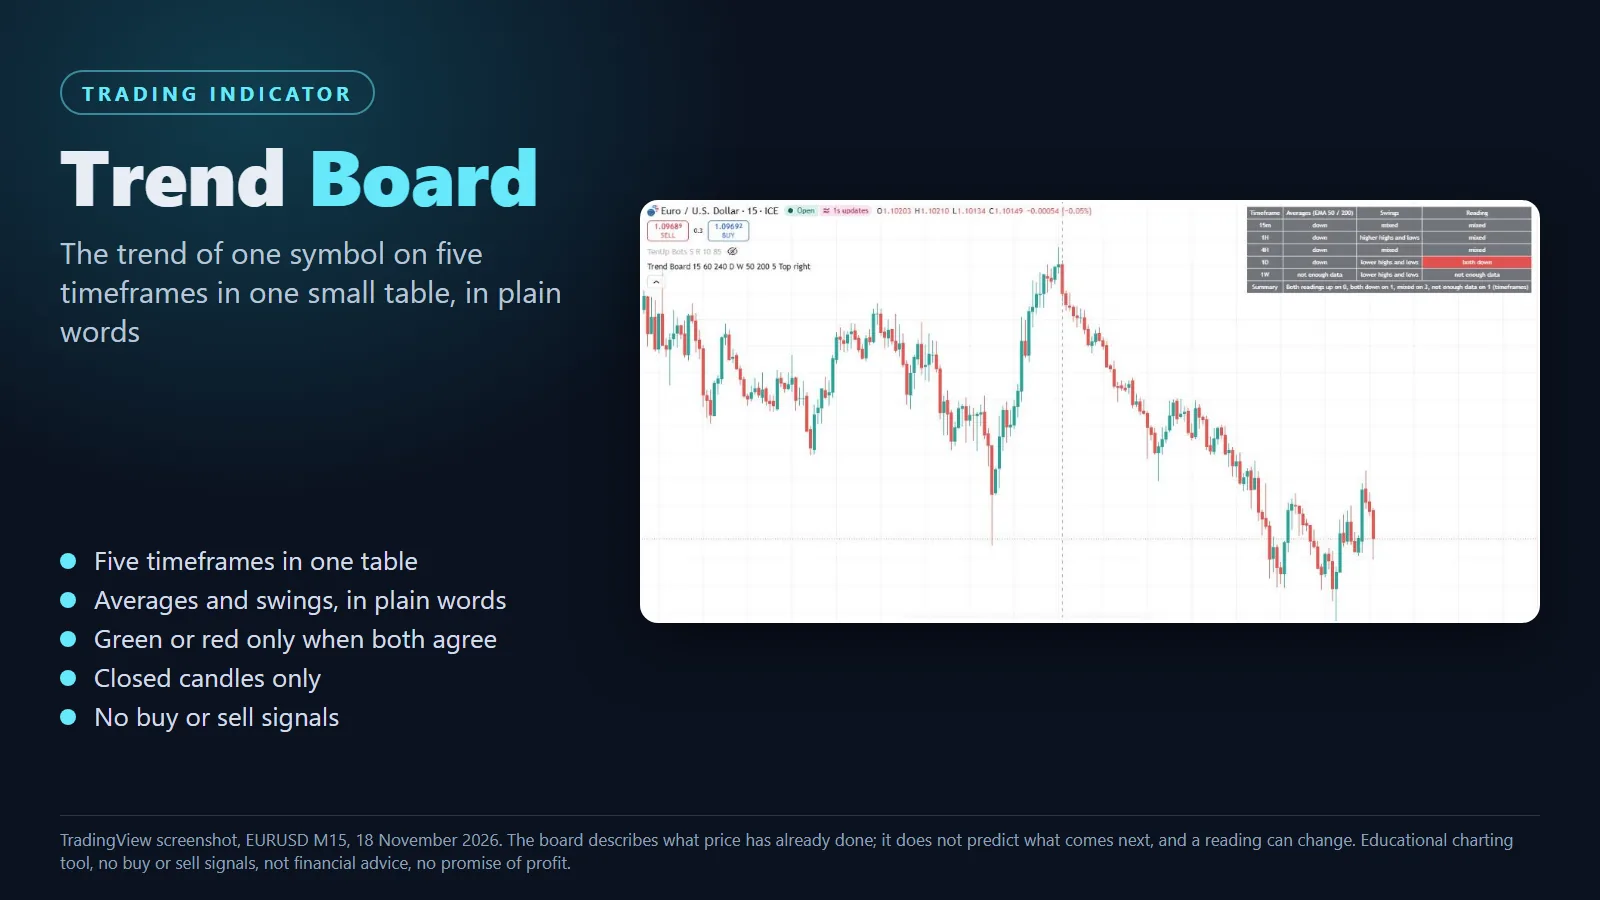
The slow average needs 200 candles of that timeframe and the swings need enough history for two highs and two lows. On a short chart history, a weekly row may not have them. The row then says so instead of guessing; on the EURUSD 15-minute chart in testing the 1-week row said "not enough data".
Can I use other timeframes or average lengths?
Yes. The settings let you choose the five timeframes, the fast and slow average lengths, the swing length and where the table sits on the chart.
Do I need a paid TradingView plan?
No. You paste the script into your own TradingView account. A free account is enough, within its limit on indicators per chart.
What if it will not load on my account?
Message us. If the files will not load on TradingView or cTrader and we cannot fix it, you can ask for a refund within 7 days of purchase.
Trend Board is an educational charting tool. It is not financial advice, not a signals service and it makes no promise of profit. Trading is risky and you can lose money.