Eight currencies, eight lines
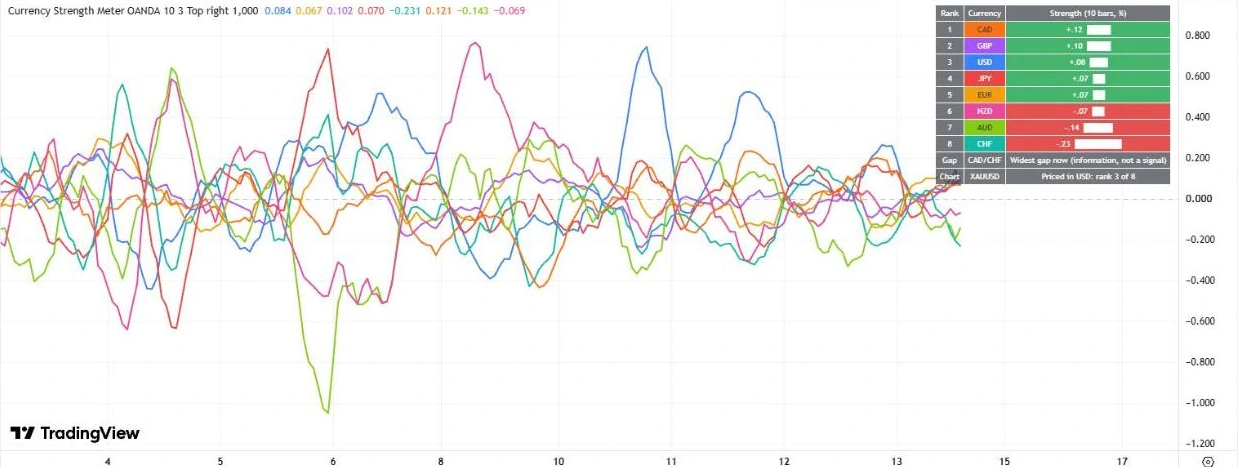
Each currency gets its own coloured line in a pane under your chart, so you see which ones are rising, falling or crossing. The lines come from the percentage change of the 28 major and cross pairs.
Charting tools for forex and gold traders
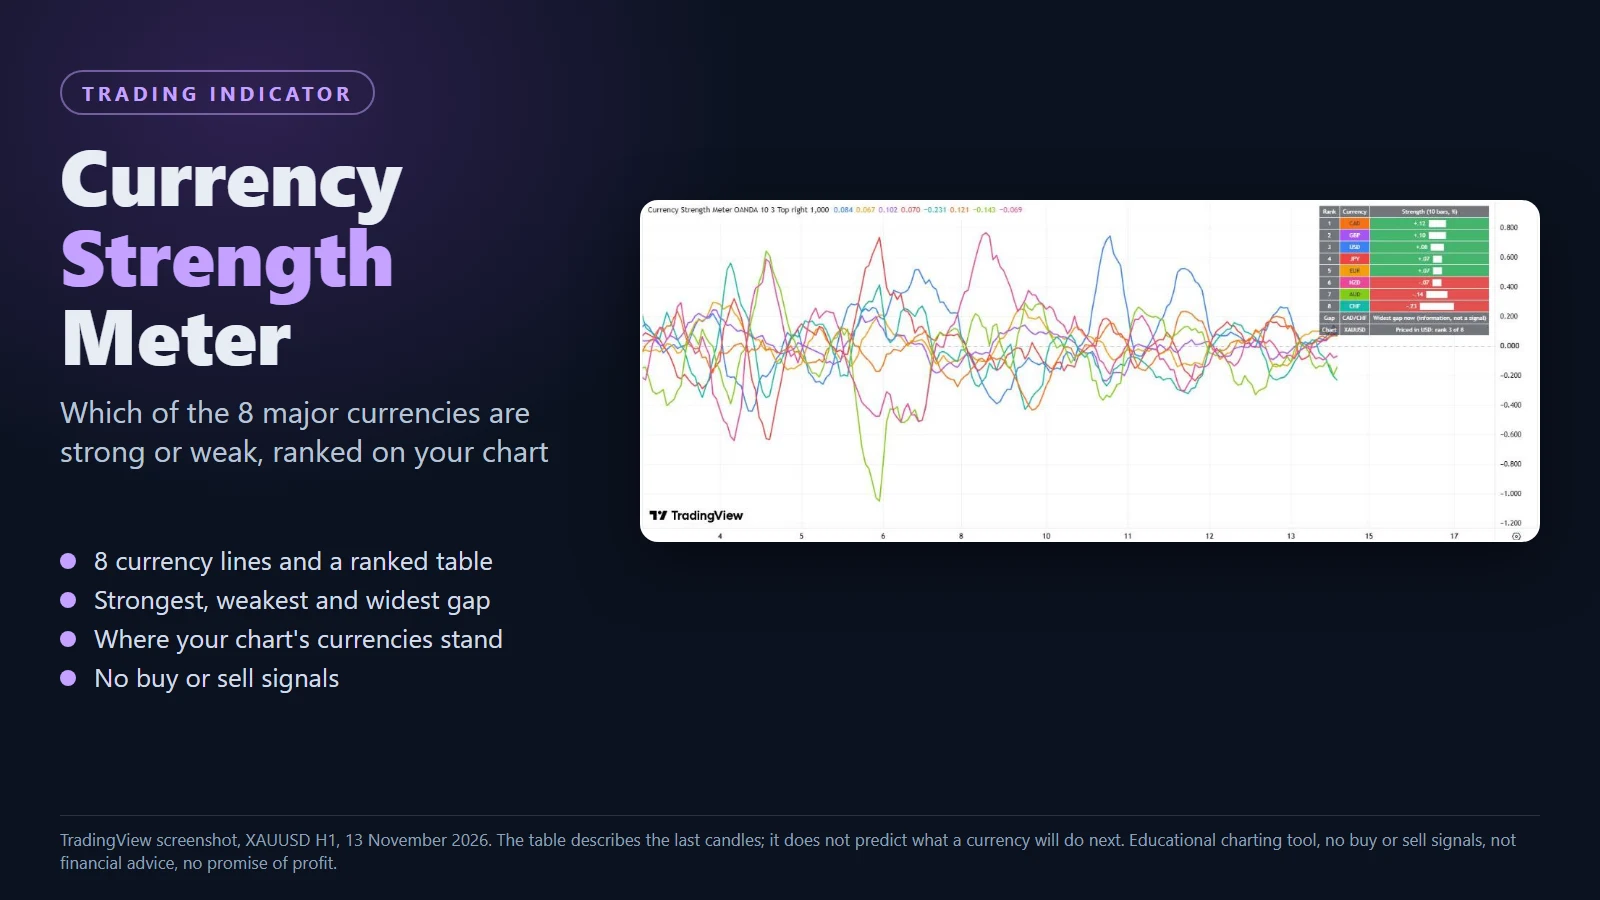
Currency Strength Meter is a charting indicator that shows which of the eight major currencies (USD, EUR, GBP, JPY, CHF, CAD, AUD and NZD) have been strong or weak over the last few candles. It draws eight lines in a pane and a ranked table, and for your own chart it shows where the currencies of that symbol stand, for example where the US dollar ranks when you look at gold. It gives no buy or sell signals: it shows the picture, and you make the decision. TradingView version (Pine Script).
US$17 per month, or US$179 per year · Educational charting tool, not financial advice.
What it does
Before a trader decides anything, they often ask: which currencies are strong right now, which are weak, and where does my symbol stand? A single pair hides this, because every pair mixes two currencies. Currency Strength Meter separates them and ranks all eight. It does not predict anything and it never says what to trade.
Each currency gets its own coloured line in a pane under your chart, so you see which ones are rising, falling or crossing. The lines come from the percentage change of the 28 major and cross pairs.
A small table ranks the eight currencies from strongest to weakest with their strength figure and a bar. Green for positive, red for negative, in the same colours as the lines.
One row names the strongest and the weakest currency, which is the widest gap between two currencies over the last candles. It is information about what has already happened, not a signal.
A row for the symbol you are looking at: for a forex pair it compares its two currencies; for gold it shows where the US dollar ranks, because gold is priced in dollars.
Choose the timeframe, how many candles to look back (10 by default), how much to smooth the lines, the data source for the pairs, and where the table sits.
Alerts when the strongest currency changes and when the weakest currency changes. They tell you what happened. They never tell you to buy or sell.
How it works
Paste the Pine script into TradingView. A free TradingView account is enough, because it takes one indicator slot.
It reads the 28 pairs itself, so it works on whatever chart you have open. Pick a timeframe such as H1.
Check which currencies are strong and weak before you decide anything. The indicator never places trades and never says what to trade.
On the chart
What you get
Honest limits
Plans
Both plans include the TradingView version and updates while the plan is active. Nothing renews or charges by itself.
Monthly
US$17 per month · about AED 62
Yearly
US$179 per year · about AED 657
The licence allows personal use on your own accounts. No resale and no sharing. Refunds: if the script will not load and we cannot fix it, you can ask within 7 days of purchase.
Choose a plan and send a WhatsApp message with the button on this page.
Pay by PayPal or bank transfer. Nothing is charged automatically.
After payment is confirmed you receive the download link and the install guide.
For the monthly plan, send the next payment before the month ends to keep updates. Nothing renews by itself.
Requirements
| Platform | TradingView (Pine Script v6). A free account works within its limit on indicators per chart. |
|---|---|
| Chart | Any symbol and timeframe. It was checked on gold and EURUSD on the 1-hour chart. |
| Data | The 28 forex pairs are read from the source you choose in the settings (OANDA by default), which is normal on TradingView. |
| Delivery | After your payment is confirmed you receive a download link for the files by WhatsApp or email. |
Questions
No. It does not say when to buy or sell. It ranks the eight major currencies by how they moved over the last candles and shows the widest gap as information. You make every decision yourself.
For each currency it averages the percentage change of the seven pairs it belongs to over the look-back you choose, counting a rise as positive when the currency is the first in the pair and negative when it is the second. A short smoothing average calms the lines.
The lines and the table follow the candles of the timeframe you choose, and the current candle is still forming, so its value moves until it closes. Closed candles do not change afterwards.
It was checked on gold (XAUUSD) and EURUSD on the 1-hour chart in TradingView. It reads all 28 pairs itself, so it also runs on other symbols and timeframes, but those were not tested.
Yes. Gold is priced in US dollars, so the table shows where the US dollar ranks among the eight currencies. That is information about the dollar, not a prediction for gold.
No. You paste the script into your own TradingView account. A free account is enough, within its limit on indicators per chart.
A cTrader version is in preparation and is not offered yet. This page lists only the TradingView version, which has been run and checked.
Message us. If the script will not load on TradingView and we cannot fix it, you can ask for a refund within 7 days of purchase.
Currency Strength Meter is an educational charting tool. It is not financial advice, not a signals service and it makes no promise of profit. Trading is risky and you can lose money.
Pick a plan and message us on WhatsApp. US$17 per month or US$179 per year.