Five shapes, named when they close
Engulfing, long wick (low or high), inside, outside and doji. A label appears next to a candle only after that candle has closed, so it never appears and disappears while a candle is still forming.
Charting tools for forex and gold traders
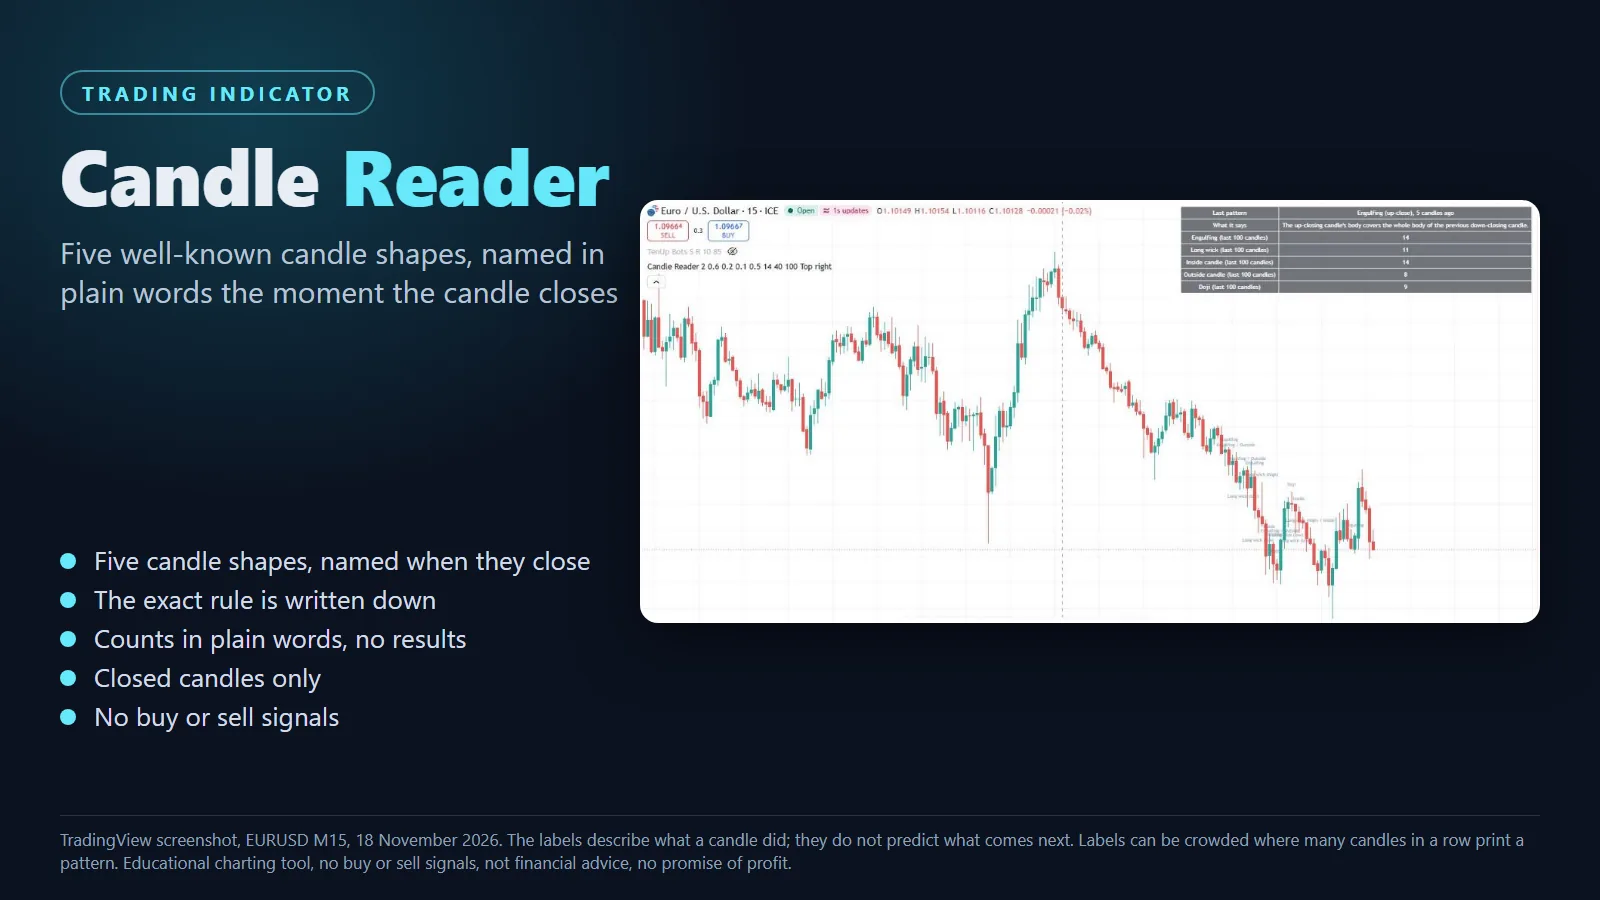
Candle Reader is a charting indicator that names five well-known candle shapes on your chart the moment the candle closes: engulfing, long wick (low or high), inside, outside and doji. The label says only what the candle did, for example that its body covers the whole body of the previous candle, and the exact numeric rule behind every shape is written down and can be changed in the settings. A small panel shows the last pattern with its meaning in one sentence and a plain count of each pattern over the last 100 candles. It does not say what a shape means for the price and it gives no buy or sell signals: it shows the picture, and you make the decision. You get the TradingView version (Pine Script) and the cTrader version (indicator file and C# source).
US$17 per month, or US$179 per year · Educational charting tool, not financial advice.
What it does
Candle names are easy to mix up, and two people rarely agree on what counts as a doji or a long wick. Candle Reader uses fixed, written numeric rules, labels a candle only after it has closed, and shows the one-sentence meaning of the last pattern in a panel, so you can see why a label is there. It does not say what a shape means for the price, it does not predict anything and it never says what to trade.
Engulfing, long wick (low or high), inside, outside and doji. A label appears next to a candle only after that candle has closed, so it never appears and disappears while a candle is still forming.
Every shape has a numeric rule you can read in the guide and change in the settings, for example: a doji is a candle whose body is at most 10% of its range. Nothing is a black box.
A candle smaller than 0.5 ATR (average true range, 14 candles; both are settings) is not labelled, so small noise candles do not fill the chart.
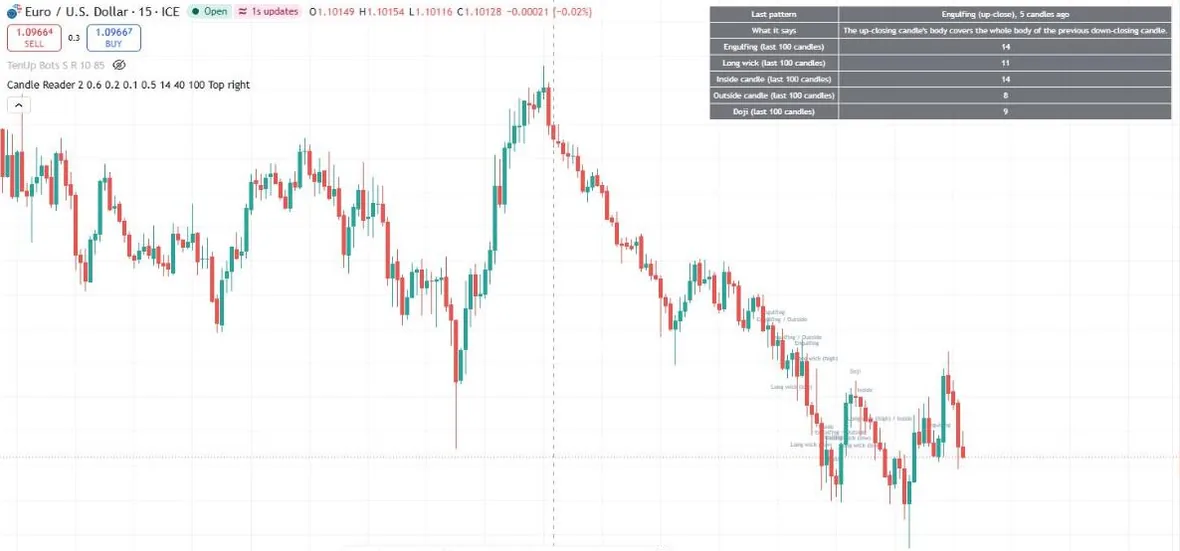
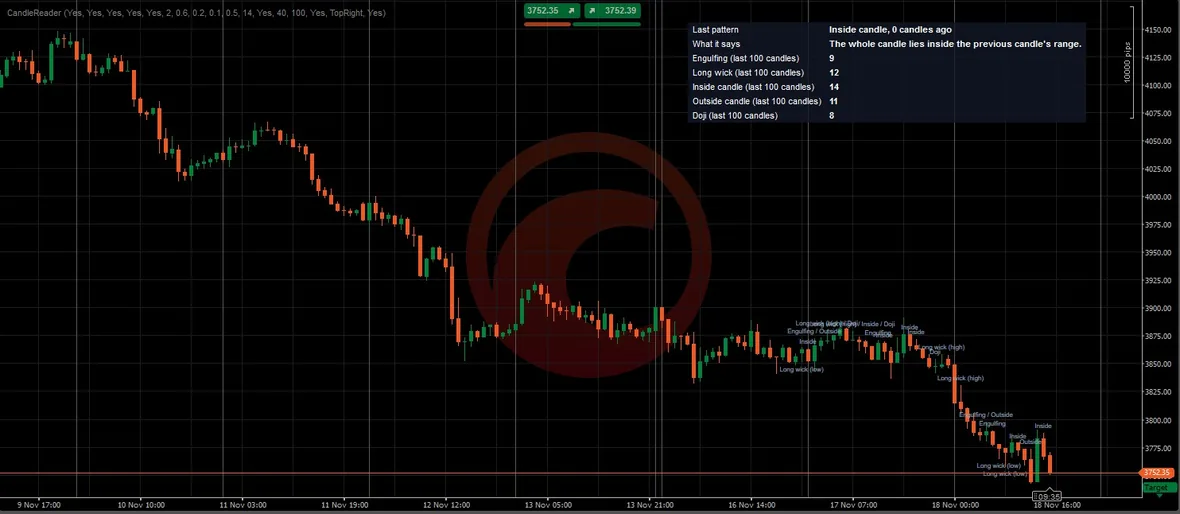
The last pattern with how many candles ago it closed and its meaning in one sentence, and a plain count of each pattern over the last 100 candles (a setting). The counts are only occurrences, not results.
Switch each pattern on or off, change the numbers of the rules, choose how many recent candles are labelled (40 by default), the count window and where the panel sits.
An alert for each shape, saying only that a candle of that shape closed on the symbol. It never tells you to buy or sell.
The words
The candle's body covers the whole body of the previous candle, is bigger than it, and the two candles closed in opposite directions. The panel says "up-close" or "down-close", not bullish or bearish.
One wick is at least 2 times the body and at least 60% of the candle's range, and the other wick is at most 20% of the range. The label says which side the long wick is on.
An inside candle lies inside the previous candle's range. An outside candle's high is above the previous high and its low is below the previous low.
A candle whose body (open to close) is at most 10% of its range: open and close are almost the same.
Average true range, the usual size of a candle on that chart. Candles smaller than half of it are skipped.
How it works
Paste the Pine script into TradingView, or install the indicator file in cTrader. A free TradingView account is enough, because it takes one indicator slot.
It uses the candles of the chart you have open, so it works on any symbol. Pick a timeframe such as M15 or H1 and, if you like, change the rules or the patterns.
Look at the labels and the panel before you decide anything. The indicator never places trades and never says what to trade.
On the chart
What you get
Honest limits
Plans
Both plans include the TradingView and cTrader versions and updates while the plan is active. Nothing renews or charges by itself.
Monthly
US$17 per month · about AED 62
Yearly
US$179 per year · about AED 657
The licence allows personal use on your own accounts. No resale and no sharing. Refunds: if the files will not load and we cannot fix it, you can ask within 7 days of purchase.
Choose a plan and send a WhatsApp message with the button on this page.
Pay by PayPal or bank transfer. Nothing is charged automatically.
After payment is confirmed you receive the download link and the install guide.
For the monthly plan, send the next payment before the month ends to keep updates. Nothing renews by itself.
Requirements
| Platform | TradingView (Pine Script v6; a free account works within its limit on indicators per chart) or cTrader (indicator file, run in cTrader 5.10.22). |
|---|---|
| Chart | Any symbol and timeframe. It was checked on EURUSD on the 15-minute chart and gold on the 1-hour chart in TradingView, and on gold on the 1-hour chart in cTrader. |
| Data | Only the candles of the chart you have open. It does not read other symbols or timeframes. |
| Delivery | After your payment is confirmed you receive a download link for the bundle by WhatsApp or email. |
Questions
No. It names the shape of a candle after the candle has closed. It does not say what the shape means for the price and it does not say when to buy or sell. You make every decision yourself.
Five: engulfing, long wick (the label says low or high), inside, outside and doji. A candle can carry more than one label, for example engulfing and outside together.
Engulfing: the body covers the whole body of the previous candle, is bigger, and the two candles closed in opposite directions. Long wick: one wick is at least 2 times the body and at least 60% of the range, and the other wick is at most 20% of the range (a candle where both wicks qualify gets no long-wick label). Inside: high not above the previous high, low not below the previous low, and a smaller range. Outside: high above the previous high and low below the previous low. Doji: body at most 10% of the range. The numbers are settings.
Every decision is made on a closed candle, so a label never appears and disappears while a candle is forming. Closed candles do not change afterwards.
No. The panel only counts how many times each shape closed over the last 100 candles (a setting). It says nothing about what happened afterwards, and no result, win rate or accuracy figure is shown anywhere.
Where many candles in a row print a pattern, the short labels sit close together and can overlap. Only the last 40 candles are labelled by default (a setting) to limit this. The panel counts and the label tooltips in TradingView still use the full names.
They follow the same rules and the same panel rows. Prices come from each platform's own data, so brokers print slightly different candles and the counts can differ a little. On the same stretch of XAUUSD H1 the counts were close but not identical (engulfing / long wick / inside / outside / doji: TradingView 11 / 11 / 15 / 12 / 7, cTrader 9 / 12 / 14 / 11 / 8). The cTrader labels show the short names only; the full names and meanings are in the panel.
It was checked on EURUSD on the 15-minute chart and gold (XAUUSD) on the 1-hour chart in TradingView, and on gold on the 1-hour chart in cTrader. It uses the candles of the open chart, so it also runs on other symbols and timeframes, but those were not tested.
No. You paste the script into your own TradingView account. A free account is enough, within its limit on indicators per chart.
Message us. If the files will not load on TradingView or cTrader and we cannot fix it, you can ask for a refund within 7 days of purchase.
Candle Reader is an educational charting tool. It is not financial advice, not a signals service and it makes no promise of profit. Trading is risky and you can lose money.
Pick a plan and message us on WhatsApp. US$17 per month or US$179 per year.